

The carbon footprint of milk over time
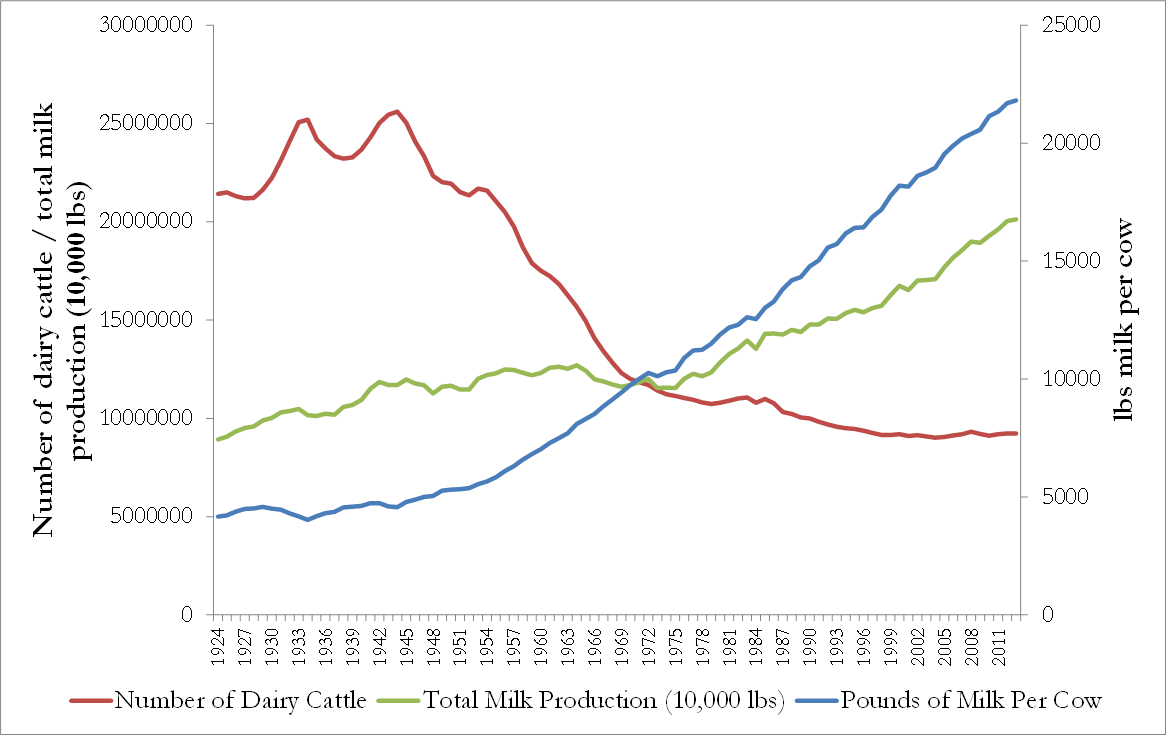
Artificial insemination allows bulls with superior genetics to have far more offspring than would be possible using natural breeding. These superior genetics have led to an astonishing rise in cow productivity in the last century. While the number of dairy cows in the U.S. has fallen from around 17 million to 9 million since 1960, total milk production has risen 40%. How? Because each cow is producing more milk. A lot more! In 1960 the average cow produced about 755 gallons (or 6,493 lbs) of milk per year, while today she will produce over 2,326 gallons (or 20,000 lbs). Each dairy cow today produces about 200% more milk compared to one in 1960!(G1,N1)
Figure 1—U.S. dairy production over time (all units on a per annual basis)
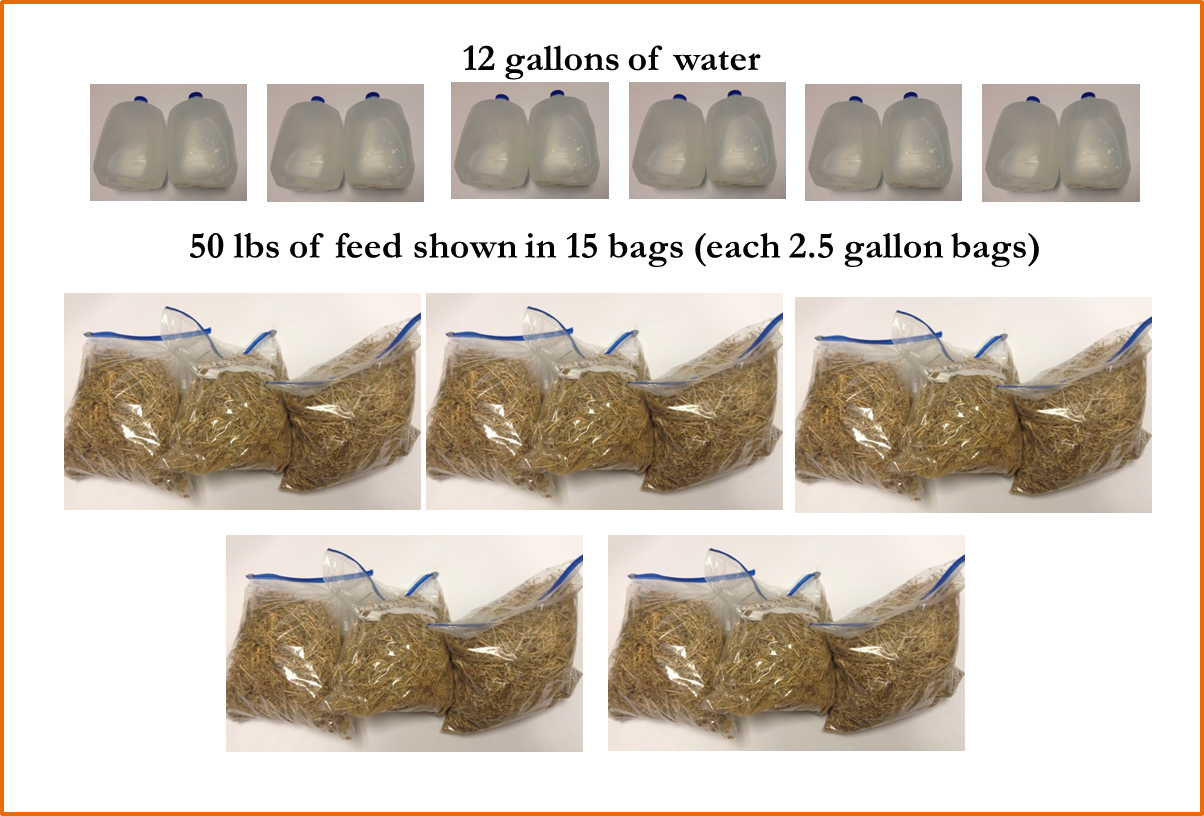
One of the best illustrations of this leap in productivity can be seen in the resources needed to produce a gallon of milk. In 1945 it took about 12 gallons of water and 50 lbs of feed to produce one gallon of milk (note: water only includes what the cow drinks, not the water necessary to raise crops for cattle feed, nor does it include water drunk in her youth), while today ...
Figure 2—What the cow needs to make one gallon of milk in 1945
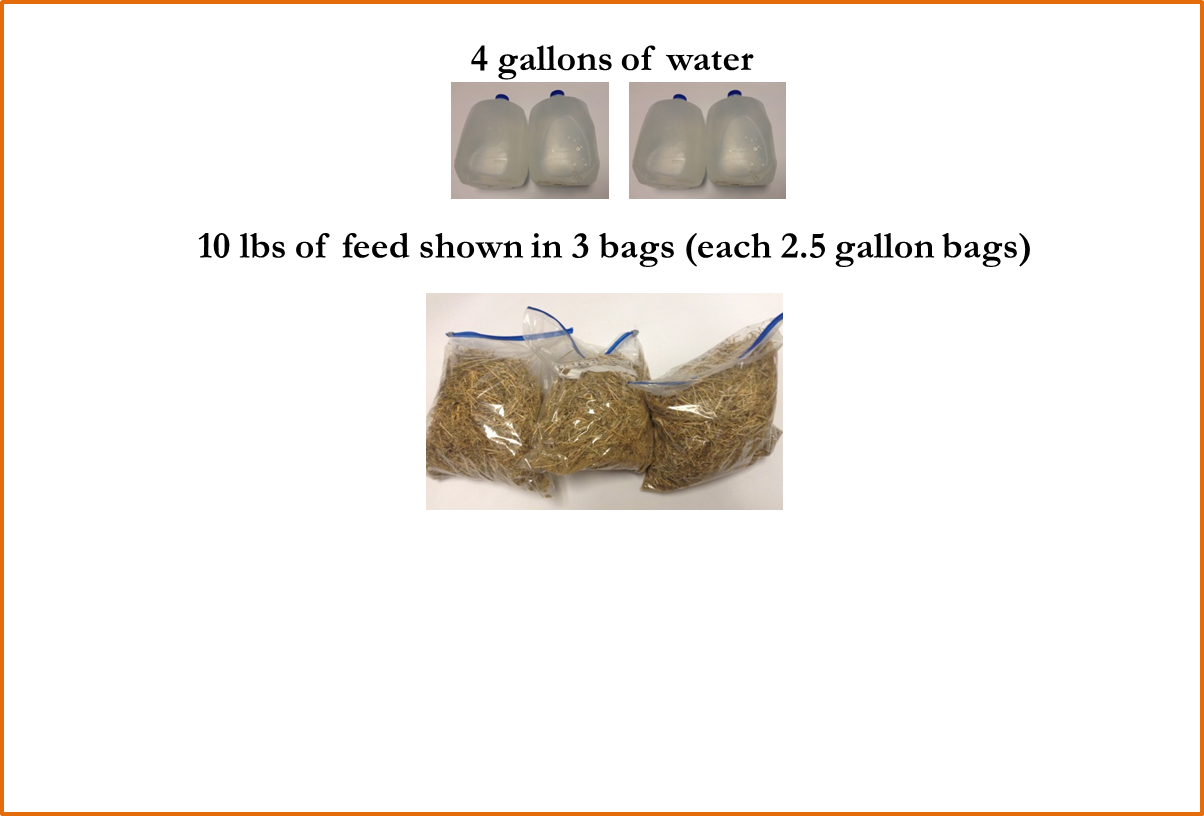
... it takes only 4 gallons of water and 10 lbs of feed to produce that same gallon of milk.(C1,D2,F3) (On the OSU dairy farm this feed consists of Alfalfa hay, Bermudagrass hay, cotton seeds, grains, and various vitamins and minerals.) For each gallon of milk you drink today, the farm requires only 20% of the feed and around 33% of the water than a gallon in 1945.
Figure 3—What the cow needs to make one gallon of milk today
By using less resources for each gallon of milk, the price of milk falls, but so does its carbon footprint. If fewer inputs are needed to produce one gallon of milk, that corresponds to fewer carbon emissions. In fact, the carbon footprint of a gallon of milk in 1945 was almost three times greater than the footprint today!(C1) (Note that “carbon” refers to carbon-equivalent emissions. For instance, methane is a greenhouse gas that creates 21 times the warming of the same amount of carbon, but instead of saying “one ton of methane” I say “21 tons of carbon”.)
This does not imply that the total carbon emissions from dairy production has fallen, as more milk is produced in the U.S. than in 1945. To measure how total carbon emissions have changed, let X be the total carbon emissions from dairy production in 1945. If the same amount of milk were produced today, the new level of emissions would be (1/3)X. However, milk production has risen 68% since 1945, and so the new level of carbon emissions from all the milk produced in the U.S. is (1.68)(1/3)X = 0.56X. Consequently, a rough calculation suggests dairy production today leads to about half the total carbon emissions compared to dairy production in 1945, despite producing much more milk.
Cows are producers of methane, a greenhouse gas, and they expel methane as they burp, which can be as often as once a minute. So being able to get more milk out of a single cow is like getting more milk for each lb of methane emitted, allowing us to consume foods we enjoy while benefiting the environment at the same time.
(Of course, you might feel that despite the lower carbon footprint total emissions from dairy production are too high, but we postpone that consideration to another lecture.)
Of this surge in productivity throughout the last fifty years, 2/3 is due to better genetics, and 1/3 is due to better management and feed.(D1)
This attention paid to genetics is a rather recent part of running a dairy farm, when viewed from the long timeline of agriculture.
Selective breeding in dairy cattle
Up until around the time of Henry VIII in England, little care was given as to what cows would be bred with another. When King Henry broke with the Catholic Church he felt it prudent to go ahead and confiscate the monastery lands and sell them to a few of his favorites. This gave big landowners the monetary incentive to increase productivity through better breeding, an incentive that wasn’t very strong for monasteries. At the time, cattle were better described as different races in each region as opposed to different breeds. Each region had its own particular genetics, and people were not eager to import the genetics of other regions.(F1) Once more thought was given to the question of which animals to breed, it became apparent that it mattered little where a bull was from so long as its offspring produced lots of milk. Following this logic, milk production rose considerably and began an institution of genetic improvements that led to distinct breeds of cattle.
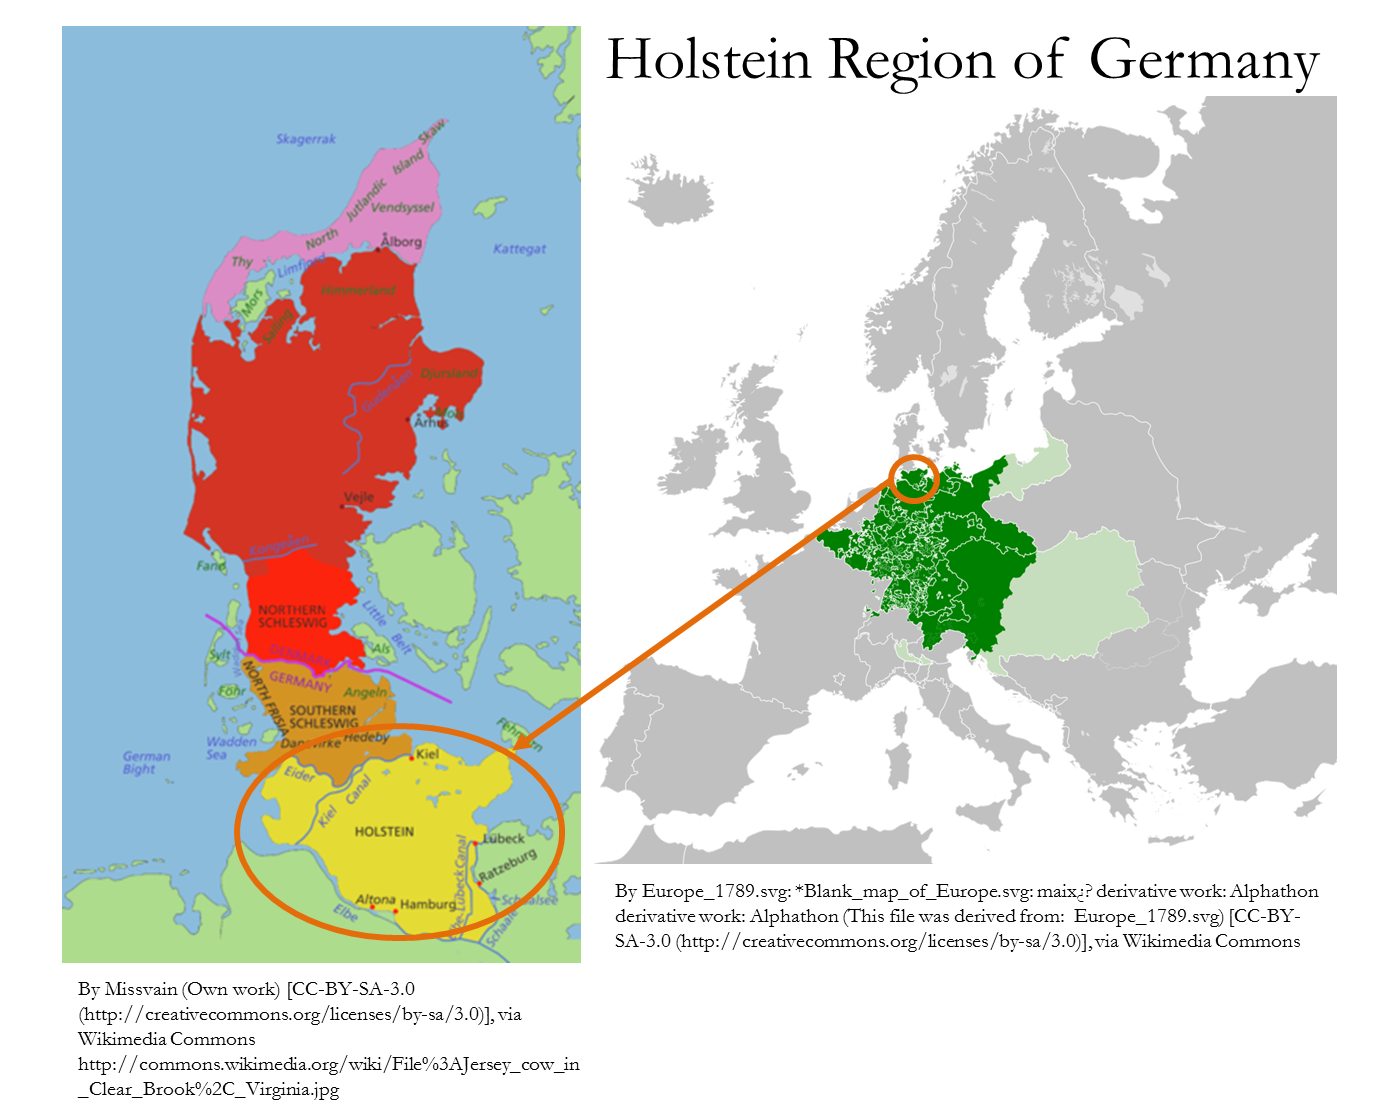
The black and white cow you see below—and in every Chick-fil-A commercial—is referred to as a Holstein in the U.S. and a Friesian elsewhere. Every now and then a recessive gene will cause them to be red and white. They are called Holsteins or Friesians because this line of cattle was developed in both the Friesland of the Netherlands and the Holstein region of Germany. These cattle were imported to the U.S. at different periods, but most of today’s U.S. Holstein cattle can trace their ancestors back to the imports arriving between 1877 and 1905,(D1) and are the most popular dairy breed because of their superior milk production.
Figure 4—Holstein breed
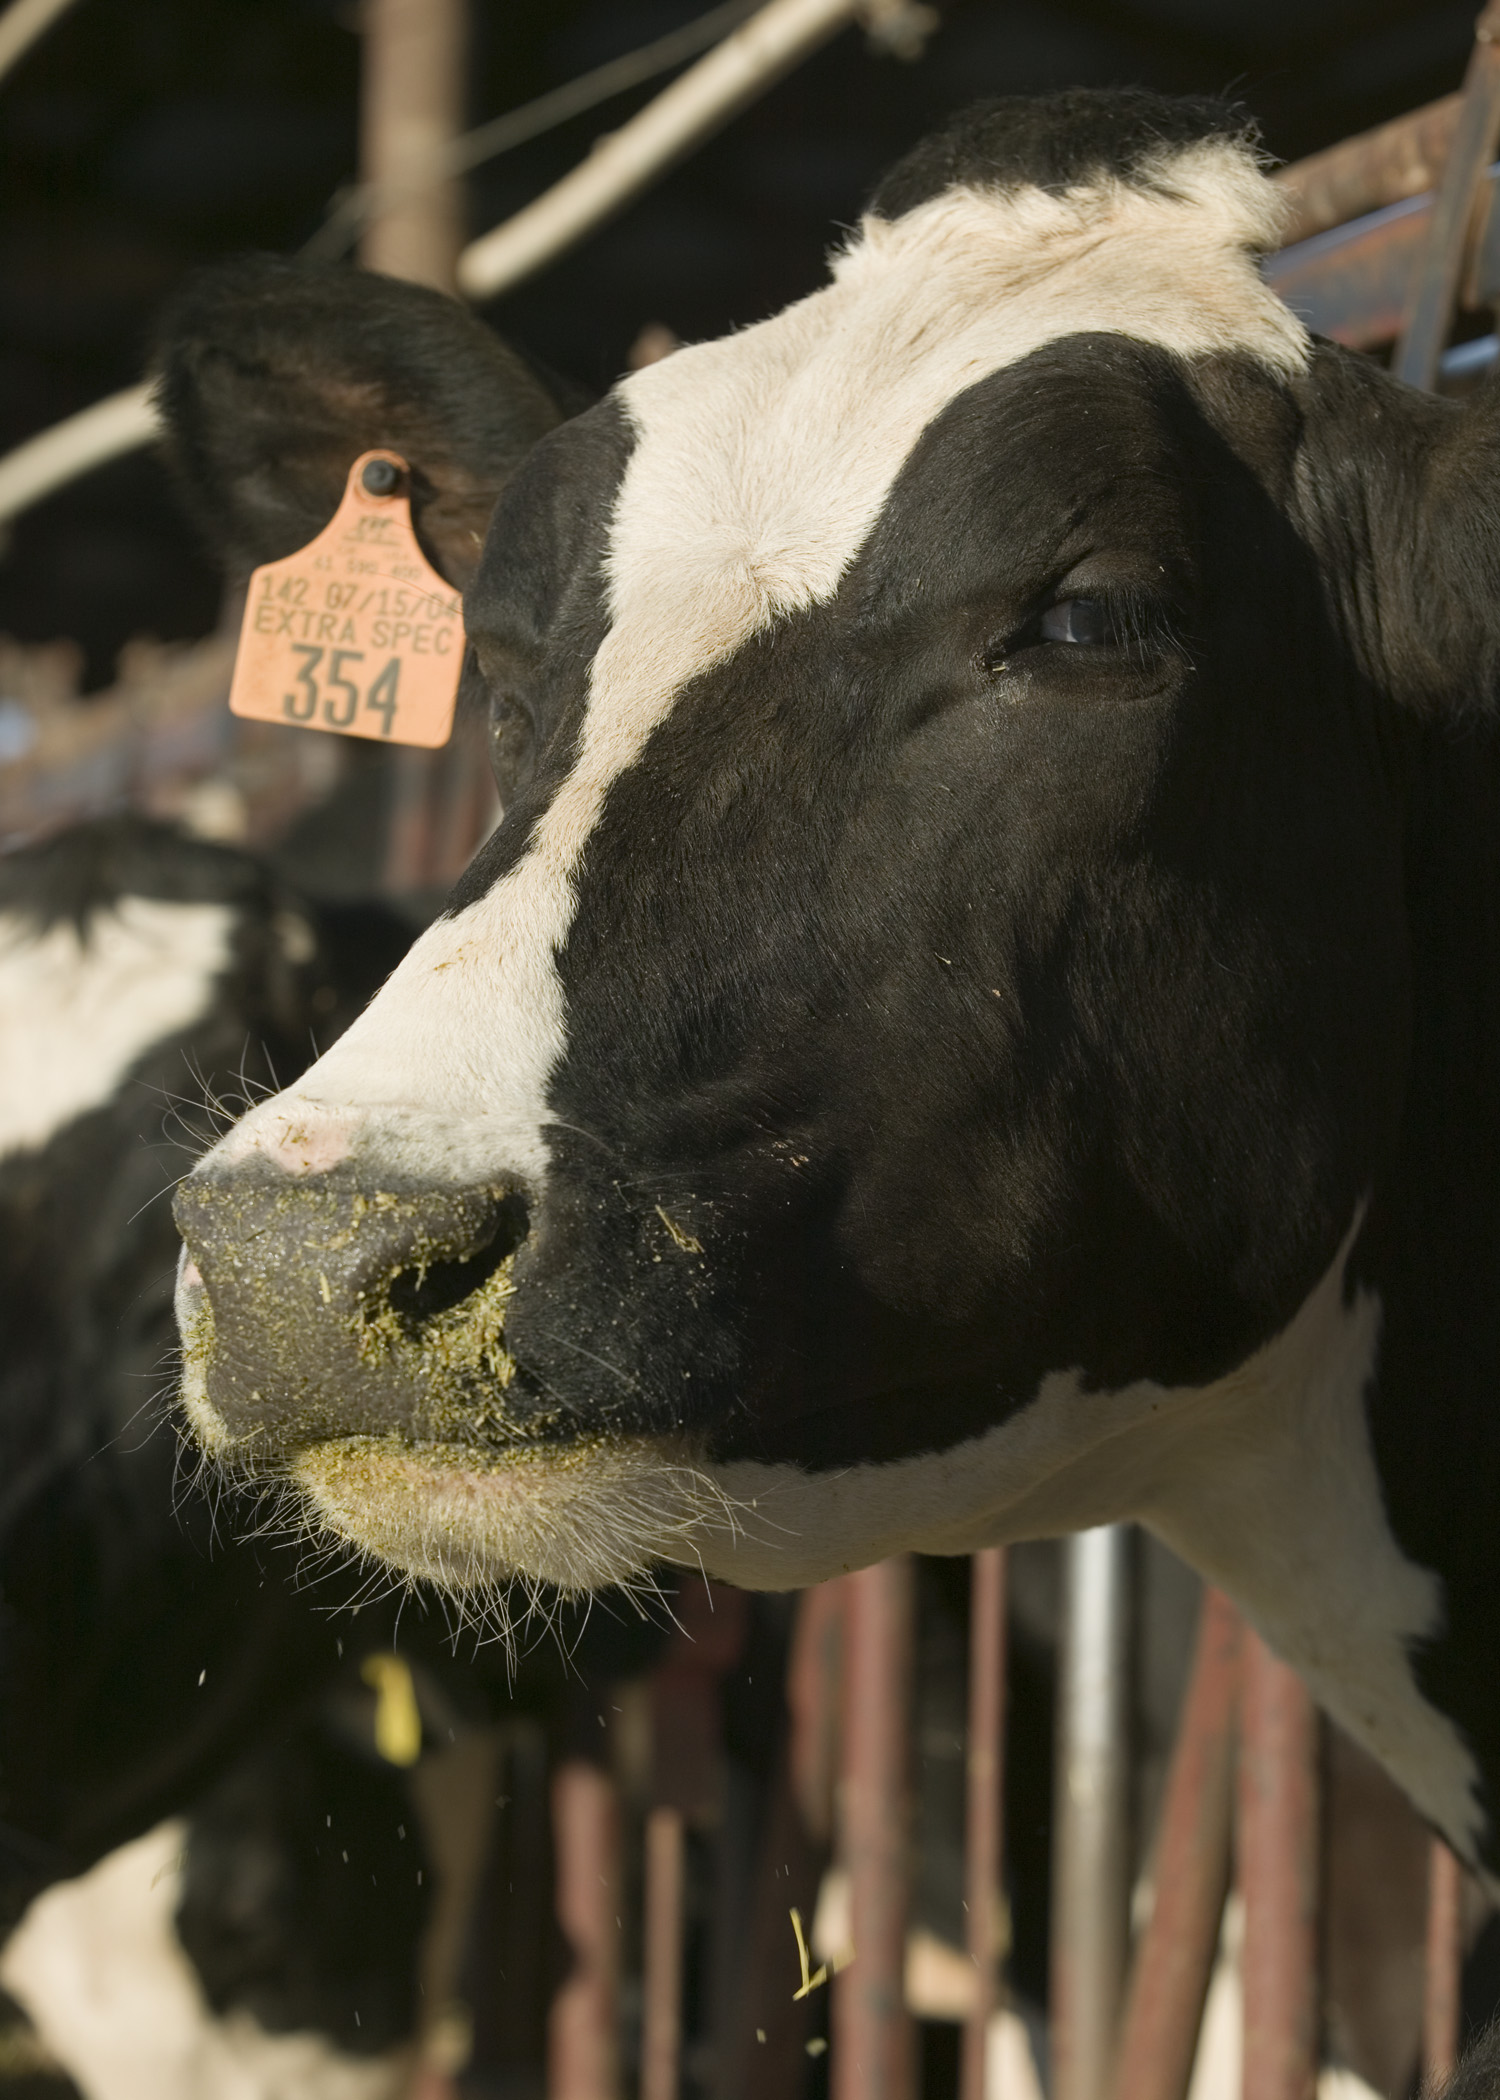
Figure 5—Origin of the Holstein breed
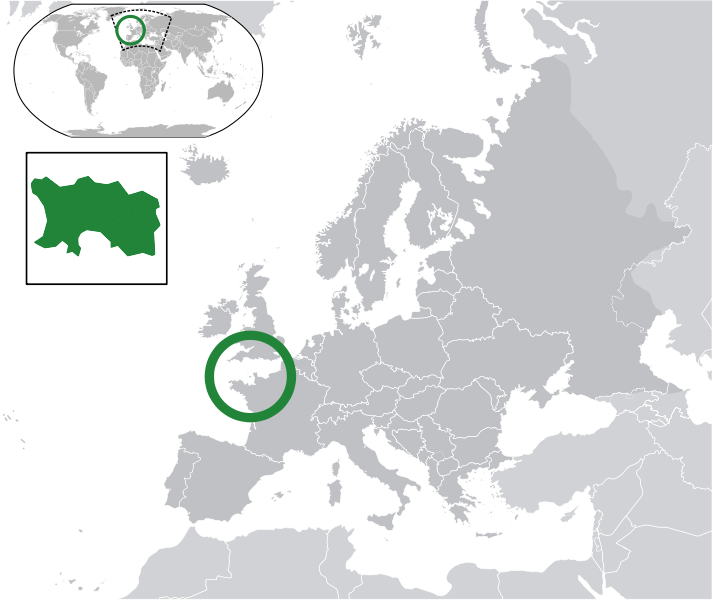
The smaller brown cows are Jersey cattle, which originated from the Isle of Jersey in the English Channel. Although a single Jersey produces less milk than a Holstein, Jerseys convert feed to milk more efficiently (Holsteins therefore produce more because they eat more). The OSU dairy farm had only a few Jerseys until the price of corn rose to historical levels, at which point they integrated more Jerseys for their more efficient conversion of feed to milk. Milk from Jersey cows is also higher in butterfat, and if butterfat is scarce relative to fluid milk, the output of Jersey cows can elicit a higher price than their Holstein counterparts. For these reasons, Jerseys can be more or less profitable than Holsteins, depending on the price of feed and consumer demand for milk, cheese, and butter. (G1)
Figure 6—Jersey breed
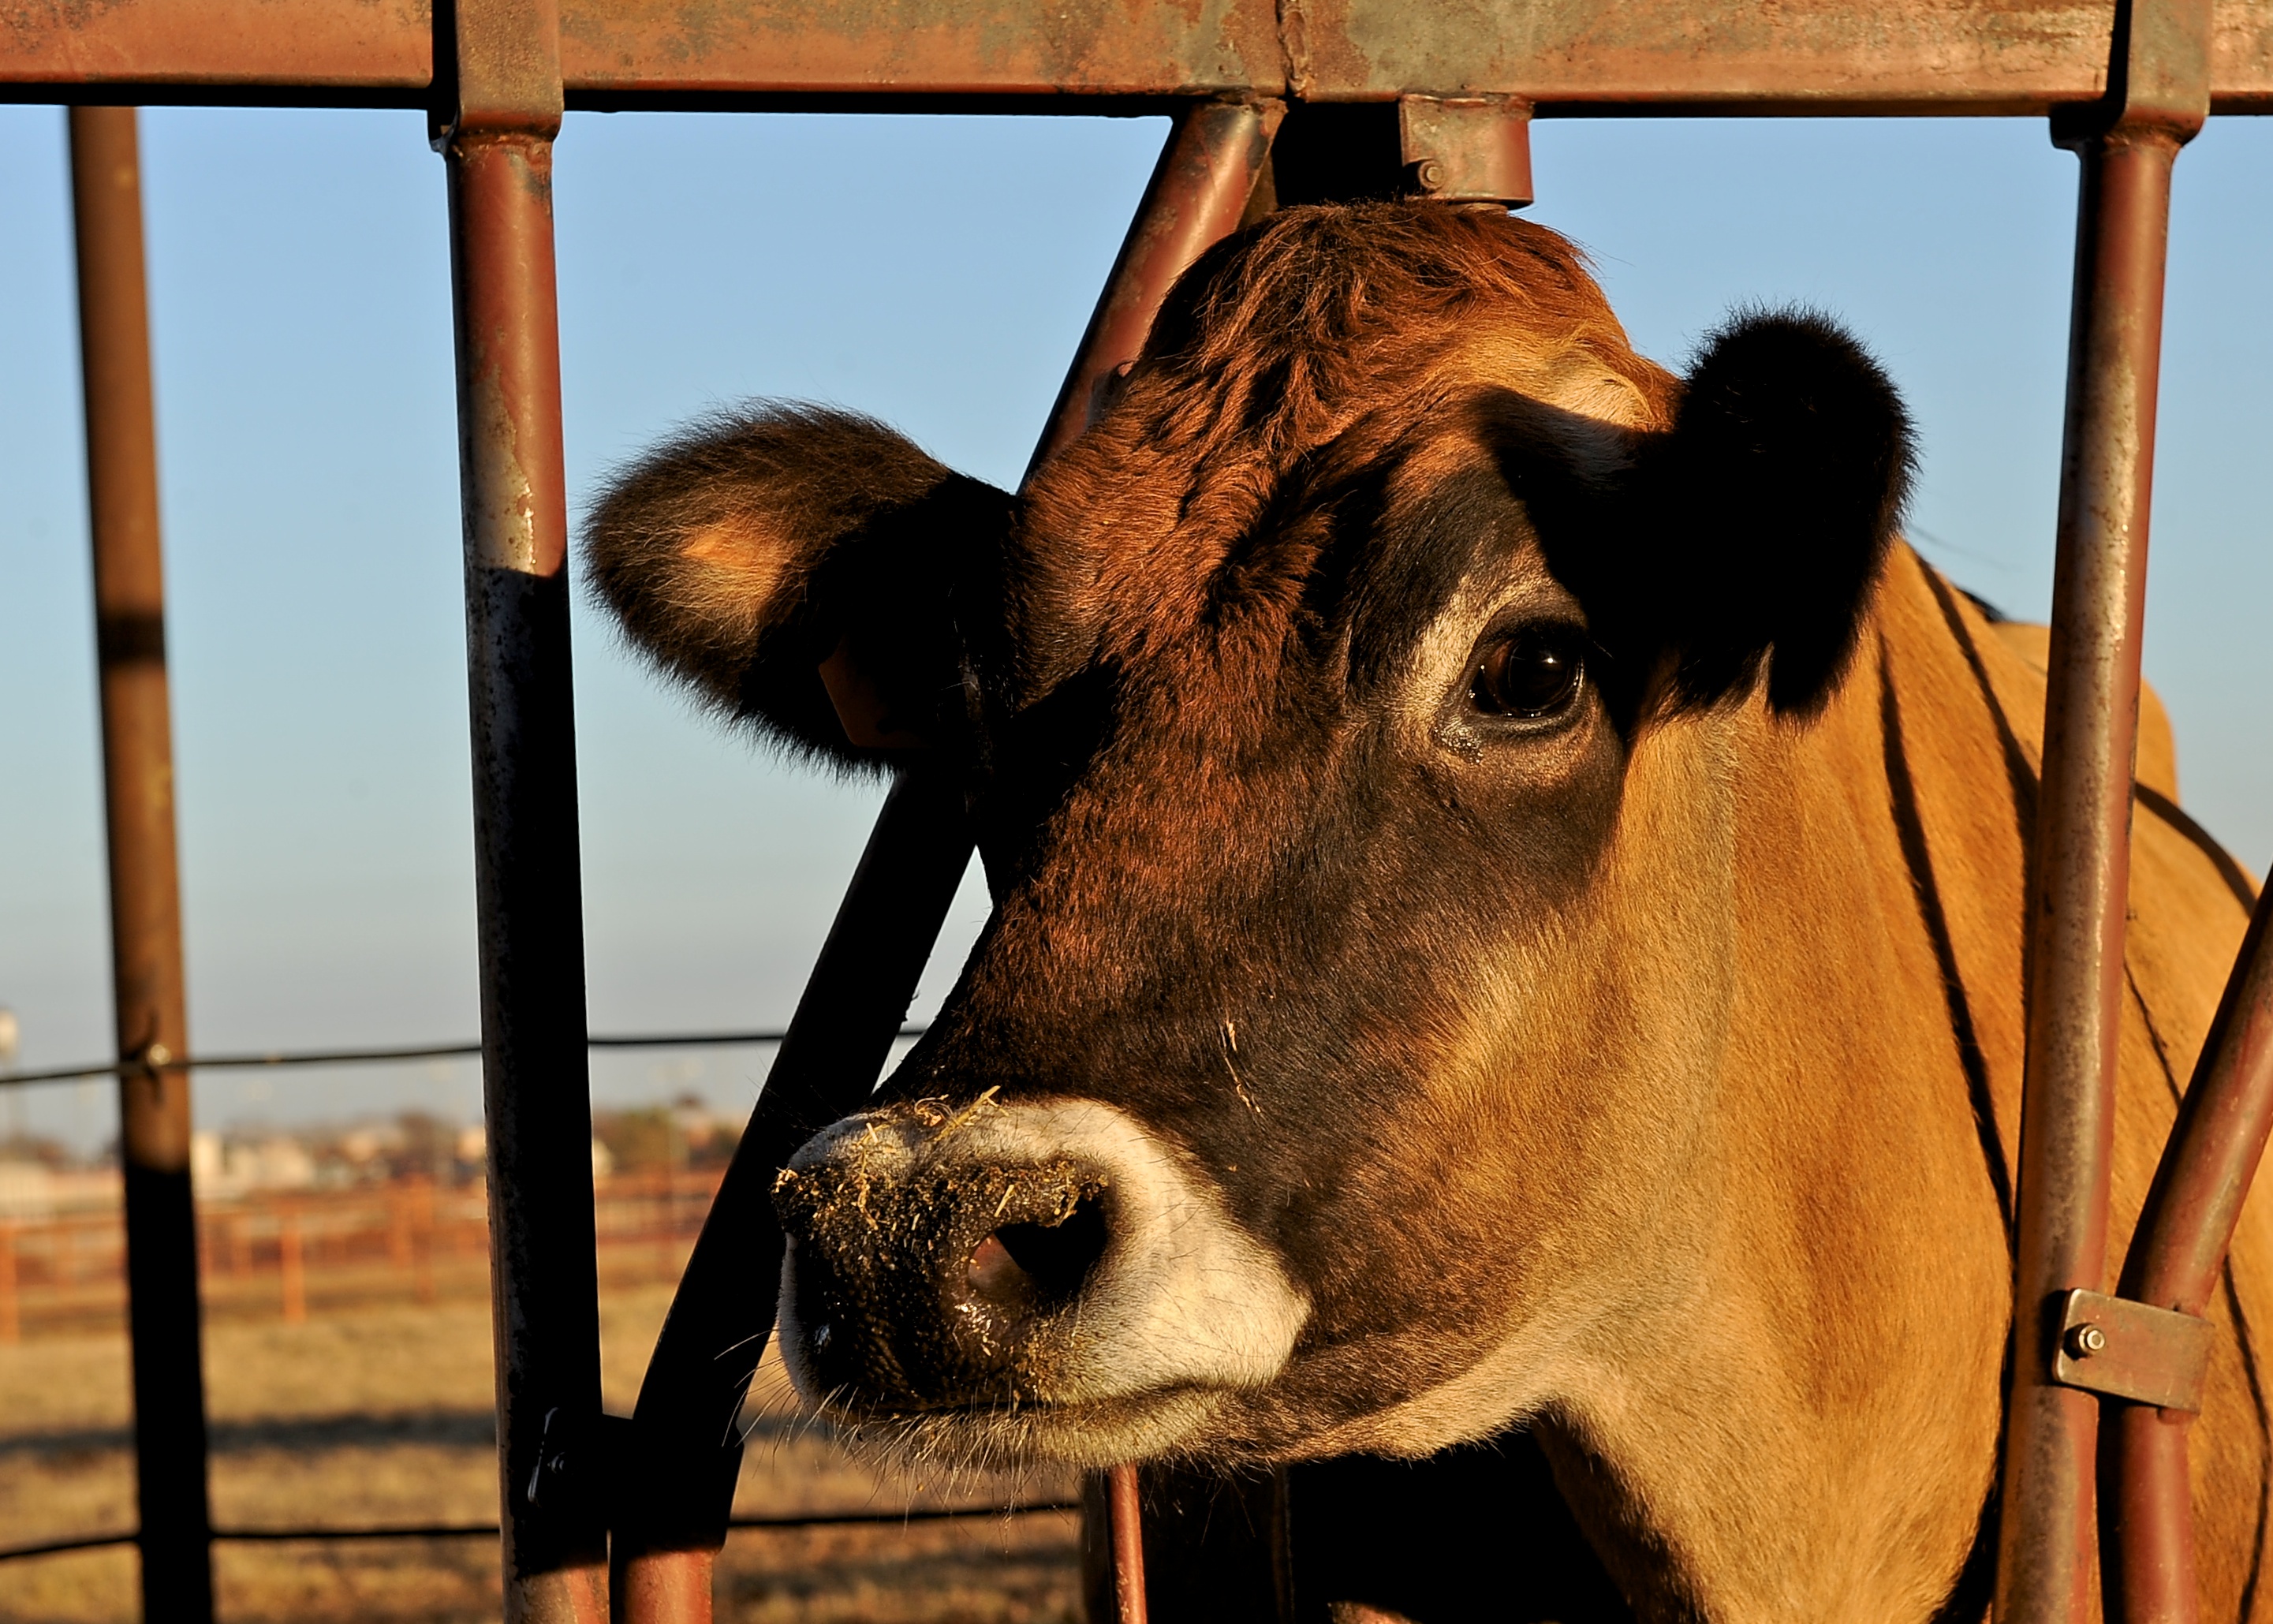
Figure 7—Origin of Jersey breed
Interestingly, while the Jersey cows are gentle and have a gregarious personality, the meanest animal I have ever seen in my life was a Jersey bull. I hear Holstein bulls are no better.
Although improvements in breeding were made after the time of Henry VIII, identifying the best bulls didn’t receive as much attention as it does today. This might be because they had ineffective means for collecting data and so no good system for designating which bulls were truly superior. The quality signals they relied on were flawed. When a farmer in the Elizabethan Age set about trying to determine whether a cow would produce a lot of milk they might look at the direction of its hairs on the rear part of her udder, a custom which had about as much validity as the many superstitions that existed at the time.(F1)
Today, milk production is a highly advanced science, and an enormous data collection program has been established, allowing dairy producers to use statistics—not myths or tradition—to identify the best genetics.
So if the carbon footprint of your milk is a major concern for you, then nothing is more important than the semen the farmer buys to impregnate her cows. The good news is you don’t need to worry about whether the farmer is reducing the carbon footprint of milk. The farmer has even more incentive than you to produce more milk with fewer inputs, and so this increase in productivity and reduction in carbon footprint over the last century came about by farmers doing what they do best: increasing the productivity of their animals. It came about out of the farmers’ self-interested pursuit of profits, not concern for the environment, as global warming did not exist as an issue in 1945.
The same thing goes for better nutrition, the second most important reason for higher dairy productivity. Before the 16th century a lot of farmers would slaughter much of their livestock in the fall because they couldn’t produce enough feed to carry them through the winter. This first changed once they learned to grow turnips for a winter feed. Over the next few centuries small advancements in nutrition were made, but still, even in 1900, the science of nutrition was hardly a science at all.(A1,M1)
The twentieth century ushered in new ways of processing feed to provide more nutrition. Corn was now cracked, ground, or made into flakes (surprisingly similar to Kellogg’s corn flakes in both appearance and taste), which allowed the cow to digest more of the corn. Dairies used to formulate feed rations based on the protein needs of the cow, but they learned that making rations based on the cow’s energy needs instead improved cattle health and farm productivity. As new varieties of grain increased yields the price of grain fell, making it cheaper to feed cattle highly nutritious grain. Better machines for raising grains lowered feed prices even more. All of this gave the dairy industry more options in what to feed, and more options translated into more nutritious feed.
Today, more thought is given into what these cows eat than what we feed our pets—or even ourselves. Computer programs are used to determine exactly what cows will be fed, and this program is used to deliver the precise nutrition needs at each stage in its life, and at the least cost the farmer. Farmers may hire consultants to help formulate feed rations, or may use some of the free programs provided by university scientists (like the Spartan 3 program by Dr. Hutjens at the University of Illinois). Whatever strategy is taken, the feed will be determined based on the size of the cow, whether the cow is lactating, an enormous amount of data on nutrition requirements and milk prices, and a computer optimization routine to make sense of it all. This is why students in agricultural economics and animal science learn mathematical optimization algorithms in college. Since roughly half of the dairy farm’s cost is feed,(D1) and since small deficiencies in nutrition can cause considerable shortfalls in milk production, a farmer can thrive or go bankrupt based on her feeding strategy.
Figure 8—Computer program to formulate dairy cattle feed
(Accessed January 6, 2013 at http://www.youtube.com/watch?v=37bHvCG92zc)

Some of the more controversial technologies like synthetic growth hormones can increase productivity but their importance is probably overrated by the general public. Giving cows injections of rBST, a synthetic growth hormone, raises milk production by 5 to 15%, but due to consumer concerns is rarely used. Moreover, it wasn’t used until the 1990s, and as Figure 1 shows, the trend in productivity began much earlier. So the major factors behind milk’s falling price are better genetics and better nutrition, and so those are the major factors behind milk’s falling carbon footprint as well.
Figures
(1) Original figure created from data accessed on July 8, 2014 at http://www.infoplease.com/ipa/A0873707.html and a price deflator at http://www.reffonomics.com/TRB/chapter20/inflationcalculator.html.
(2 and 3) Original figure. Sources: F1, D1, C1.
(4) Photo from DASNR Kitchen Sink
(5) Maps taken from Wikimedia Commons (source is in the picture)
(6) Photo from DASNR Kitchen Sink
(7) Maps taken from Wikimedia Commons
(8) Screenshot from YouTube.com