

Quick motivation
Most everyone learns a few key concepts of physics in high school. They learn that light is both a wave and a particle, and that different colors are just different wavelengths of light. Perhaps they also learn that light is just one of many forms of electromagnetic radiation. They learn the basic structure of an atom, and how an atom absorbs heat and then emits light. Most of us forget exactly what pH is, but we have heard the term in school (and in shampoo commercials).
There are good reasons for learning these concepts. As we will see, they are integral to producing plentiful food without causing excess damage to the environment. Apply too little fertilizer and food prices rise. Apply too much and waters become polluted. How do farmers then apply the “right” amount of fertilizer? By taking samples of the soil in their fields and submitting them to a soil test laboratory, where the amount of nutrients within the soil is measured, and recommendations as to how much fertilizer of what type should be applied. Measuring the nutrient content of soil requires machines built on advanced principles of physics. We thus learn physics not just for the sake of learning, but to simultaneously feed ourselves and protect the environment. In this lecture we will tour the soil test laboratory at Oklahoma State University (OSU) and discuss the key concepts behind the technologies, as well demonstrate how farmers use the results.
(A.1) Taking a soil sample
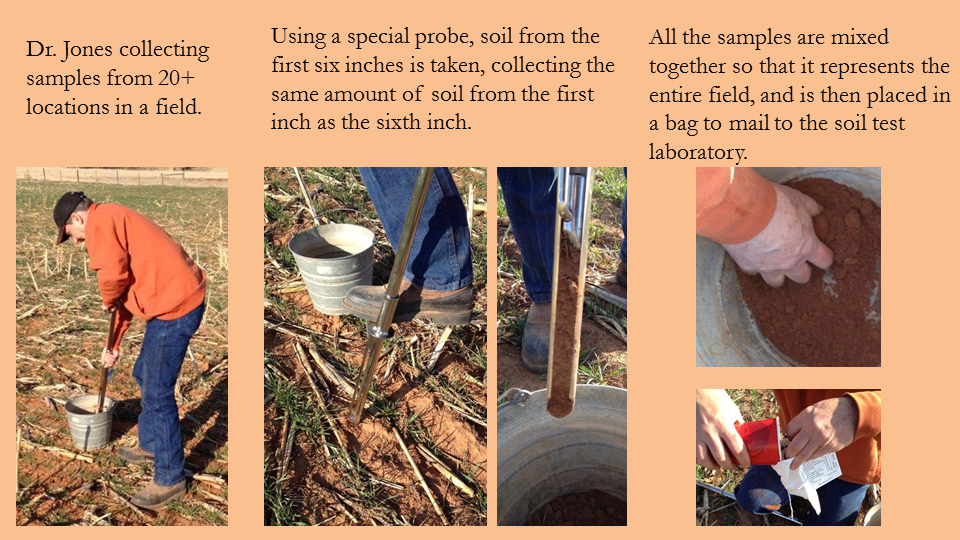
The first step in a farmers’ fertilizer decision is to measure the nutrients contained in the soil. This requires a soil sample that is representative of the entire field, suggesting that different samples should be taken at many different places. Samples should be taken on the north, south, east, and west side. In the middle. Between the middle and the northeast side, and so on. Research suggests that this requires a minimum of 20 different locations. The ideal time for testing is between the harvest and next planting.(Z1)
Each of the 20+ samples should be taken at a depth of six inches for most crops, though some deep-rooted plants like alfalfa might require a sample up to 18 inches below the surface. You do not want to take this sample with a shovel, as it will collect more soil from the shallow than the deeper parts, when they should be equal. That is, the soil sample should contain the same amount of soil from the first inch, the second inch, the third inch, and so on. A special tool, shown in Figure 1 below, has been created to ensure this is the case.
Once the 20+ samples are taken they should all be mixed together so that they represent the entire field. A portion of this sample is then placed into a special bag provided by the soil testing laboratory. Before sending, the farmer indicates on the label what type of test she is interested in, the crop she plans to raise in the following year, and her desired yield (like bushels of wheat per acre). The bag is then mailed to the soil test laboratory and within two weeks the results are posted online.
To illustrate how soil tests are taken, analyzed, and used, I asked my colleague, Dr. Rodney Jones, to take a soil sample from one of his corn fields, as shown in in Figure 1. In this article we will learn how that soil test is conducted and how the results impact Dr. Jones’ fertilizer decisions.
Throughout this lecture I will post excerpts from the soil sample test results, but if you want to download the report you may find it here.
Figure 1—Dr. Jones taking a soil sample
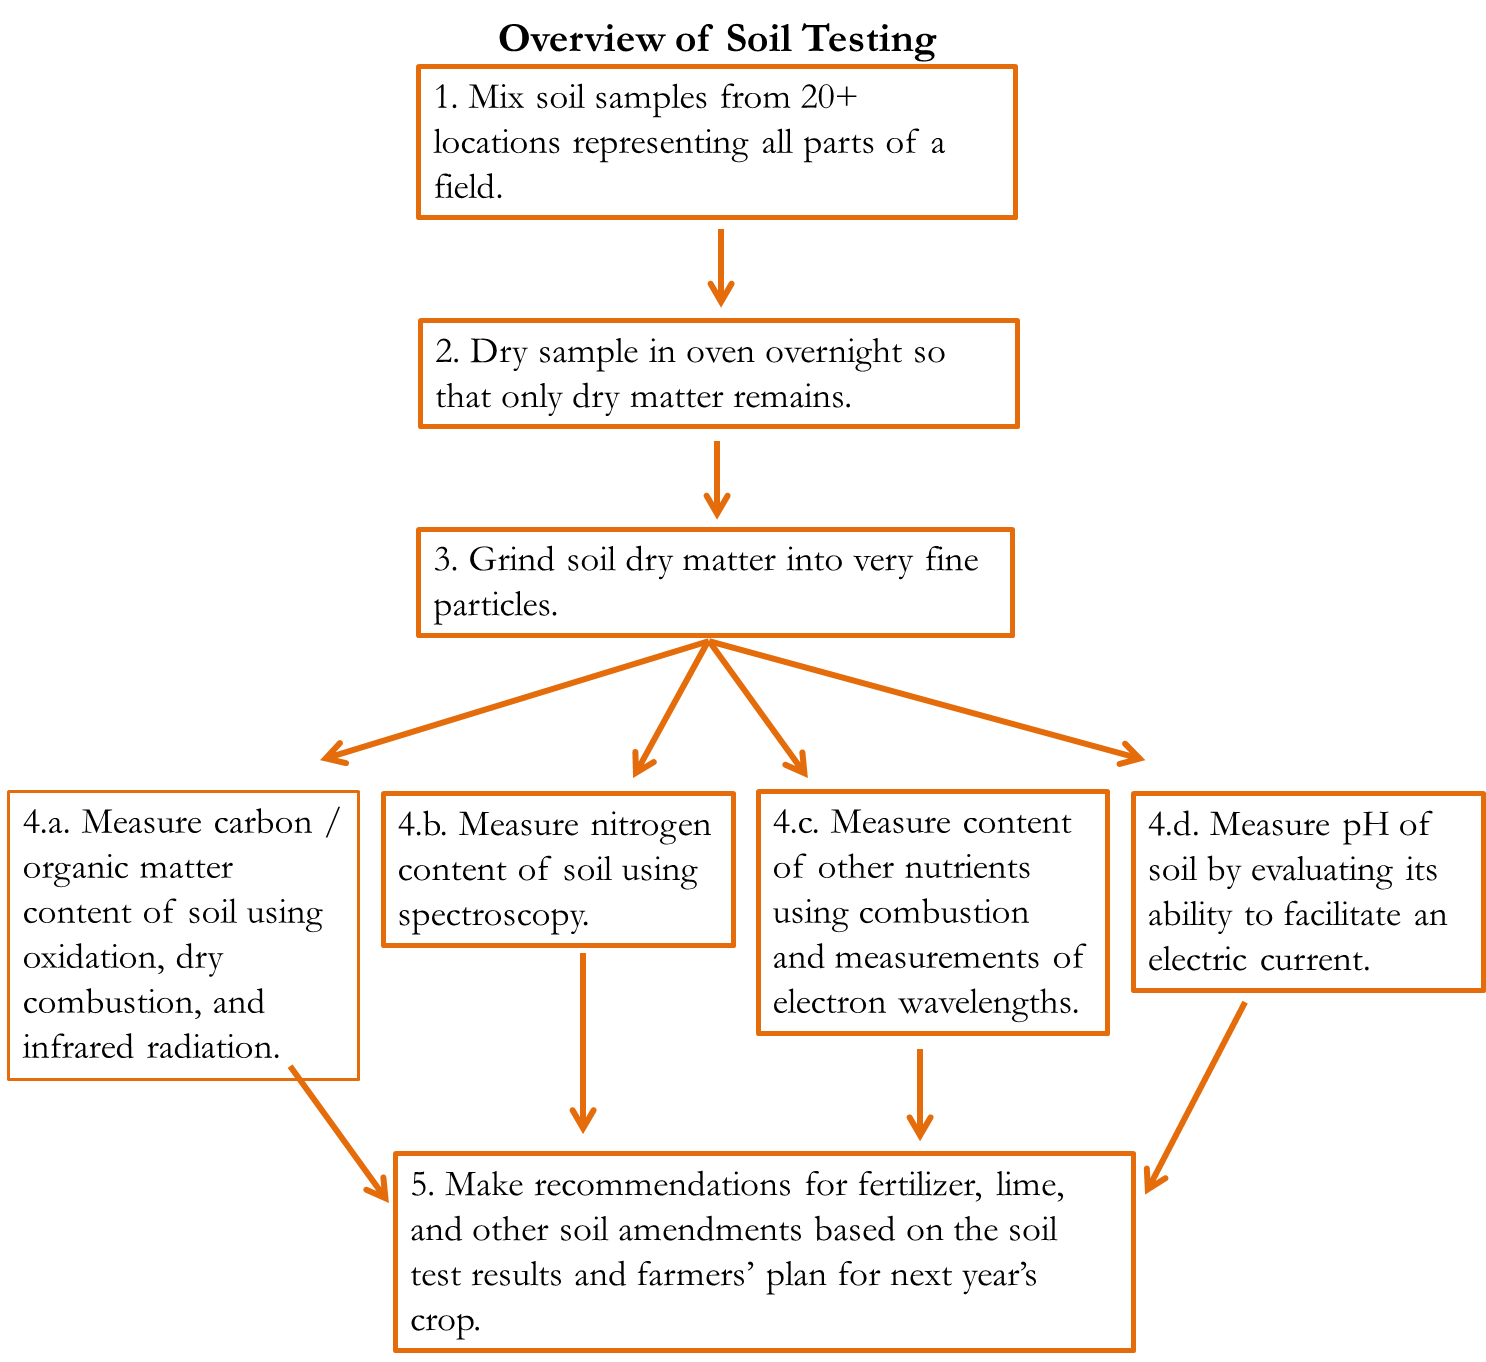
When the sample arrives at the laboratory it is first dried in an oven overnight so that all that remains is dry matter. A grinder is then used to pulverize the dry matter so that it is almost a powder (specifically, each particle is 2 millimeters or less). Then, portions of this sample are used to assess its nutrient content, organic matter content, and the soil’s pH.
(A.2) Plant nutrient needs
Plants’ primary nutrient needs are hydrogen, oxygen, and carbon. Hydrogen and oxygen are acquired through rain and irrigation and do not remain long in the soil, so they are ignored in soil tests. Plants acquire carbon largely from carbon dioxide in the air, but as we will see, farmers are often interested in the carbon content of their soil.
Farmers are mostly interested in the three primary macronutrients: nitrogen, phosphorus, and potassium. When the general term “fertilizer” is used it usually refers to these three nutrients. Plants need relatively large amounts of these nutrients and they can be stored in the soil, so farmers need to know how much is currently in the soil before they decide how much fertilizer to apply.
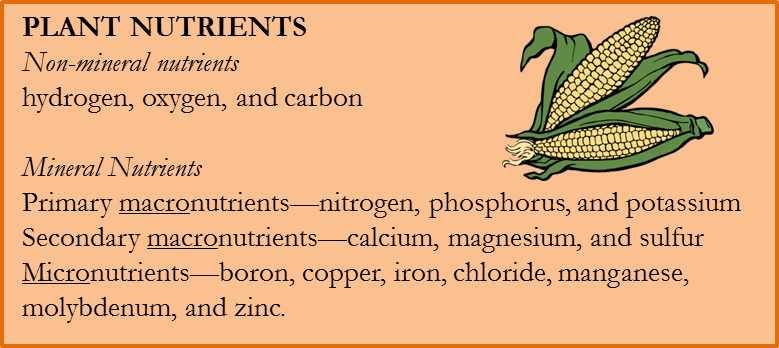
Sometimes farmers test for secondary macronutrients and micronutrients, but most soils have enough to last decades, so annual testing is usually unnecessary.
Regardless of how much nutrients are in the soil, the plants cannot consume them if the pH of the soil is too high or too low, so annual pH measurements of a field’s soil is not uncommon.
In the discussion below, we will take a tour of the soil test laboratory to understand how
- infrared radiation is used to measure the carbon,
- spectroscopy is used to gauge the nitrogen,
- electron waves are detected to measure a variety of nutrients like phosphorus and zinc,
- and energy conductivity is used to measure the pH level of a soil.
As we learn how these items are measured we will observe the actual results of the soil sample from Dr. Jones’ farm, and discuss how these results would affect his farm management strategy.
(B.1) Nitrogen
Nitrogen is a volatile compound in that it is easily dissolved in water or converted to a gas. Because it is so volatile it rarely stays in the soil for long. Plants also need large amounts of it, as nitrogen (along with hydrogen, oxygen, and carbon) is a component of all protein molecules, so when farmers submit a soil test the most important measurement is the soil’s nitrogen content.
This is accomplished using a flow injection analysis machine, which only measures nitrite (NO2-), so all plant-available nitrogen in the soil sample must be converted to nitrite. This requires first extracting this nitrogen from the soil using an extracting solution, where all nitrogen is converted to nitrate (NO3) and dissolved in water. The nitrogen can then be transported in a solution, separate from the soil dry matter. Then, it is delivered to something called a Lachat-Flow injection analyzer, where the nitrate is converted to nitrite, which is also water soluble.
Finally, this nitrite solution is sent to the flow injection analysis machine so that nitrogen levels can be measured using tools of spectroscopy, which is the study of how matter reacts with light (or any form of radiation). The liquid enters a chamber where the solution is held between an emitter and a receiver of a particular wavelength of light. The less light that can pierce through the solution and reach the receiver, the greater the nitrite concentration, and the more plant-available nitrogen in the soil.
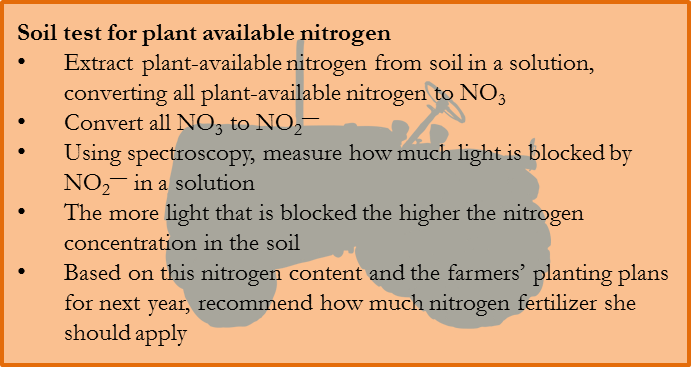
This should be intuitive. We can tell the strength of a cup of tea by how dark it is, and a “dark” tea is simply one in which little light passes though. In the same spirit, machines read the amount of nitrites in a water solution by how much light is prevented from passing.
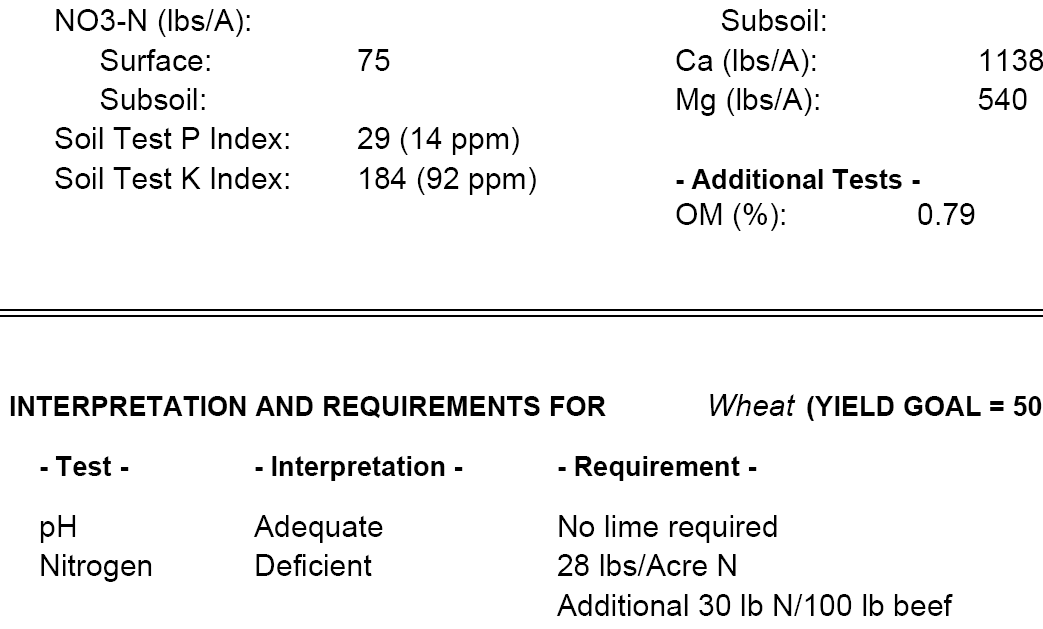
(B.2) Soil test results: plant-available nitrogen
Looking again at the tests for Dr. Jones’ soil, the results are reported using the term “NO3-N” in lbs per acre. Ignore the “NO3-” part, and just note that it is measuring the amount of actual plant-available N in the soil, regardless of the amount of other elements (like oxygen) attached to it. Looking further down the soil test results, the soil is said to be deficient in nitrogen. Given Dr. Jones’ desire to harvest 50 bushels of wheat per acre next year, it suggests that he add 28 lbs of nitrogen per acre. It also shows the extra nitrogen he should apply if he plans to graze cattle on the young wheat plant.
Figure 2—Excerpt from soil test results regarding nitrogen
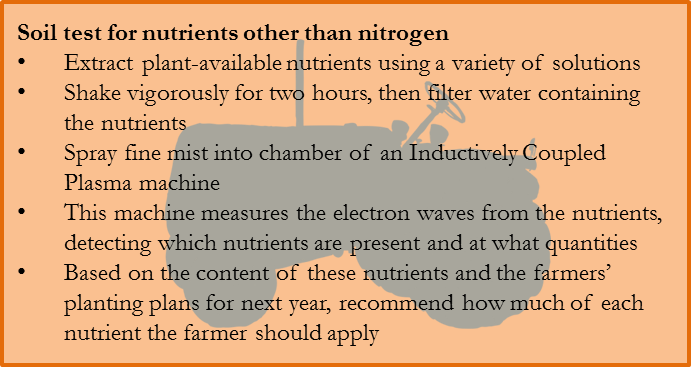
(C.1) Other nutrients
All other nutrients in the soil sample are measured using an Inductively Coupled Plasma (ICP) machine. The dry soil sample is mixed with one or more liquid solutions, shaken vigorously by a machine for two hours, and then filtered. The filtered water now contains all phosphorus, potassium, calcium, zinc, and other nutrients that are available to the plant. If some of a nutrient is in a chemical form such that it is not available to the plant, then this portion of the nutrient is not measured.
The solution is then sprayed as a fine mist into a chamber in the ICP containing an ionized argon plasma, burning at a temperature of 7,000 to 10,000 degrees Celsius. As a reference point, the surface of the sun is only 5,500 degrees Celsius!(C2,V1) You might wonder why the machine doesn’t melt at such a temperature. That was my first question also, and though I don’t really understand the process well, I have come to think of it in the following way. There is something about using an argon gas that allows the machine to create a “floating fireball”. Within the fireball it is ridiculously hot, but that fireball never touches any solid of the machine and radiates surprisingly little heat.
To understand how this heat reveals which minerals are present and in what quantities, we must recall how atoms respond to heat.
(C.2) Heat, photons, and electron waves
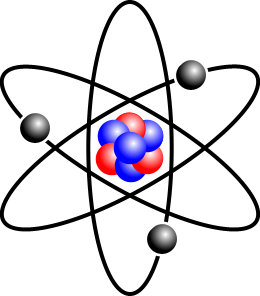
The nucleus forms the center of an atom, and usually consists of protons and often neutrons. Orbiting the nucleus are electrons. For example, the hydrogen atom has a nucleus of one proton and no neutron, with one orbiting electron. When an atom is heated this energy is absorbed by the atom, and this absorption causes the electron to orbit at a greater distance from the nucleus. This electron does not wish to orbit at a greater distance though, so it will eventually jump back down to its natural orbit, and when it does it releases a photon. Photons are particles of light. This is why an electric stove emits an orange light when it gets hot. The electric heat pushes electrons in the metal burner to orbit further from the cell nucleus, and when the electrons return to their original orbit they emit an orange light.
Figure 3—Depiction of atom with red = photons, blue = neutrons, black = electrons
You have probably noticed that different materials emit a different color when they become hot. The electric stove’s light is orange, while gas stoves emit a blue light. Ancient humans saw something profound in these colors. They thought salts were magical because when thrown into a fire it produced a violet color. Strontium salts impart a red flame,(C3) while Methanol and Boric acid produce a green fire.(M1) The reason is that different atoms vary in their number of electrons and protons. As a result, when heated, they emit different varieties of photons, which appear to us as different colors.
Figure 4—Atom absorbing heat and releasing photons (light)
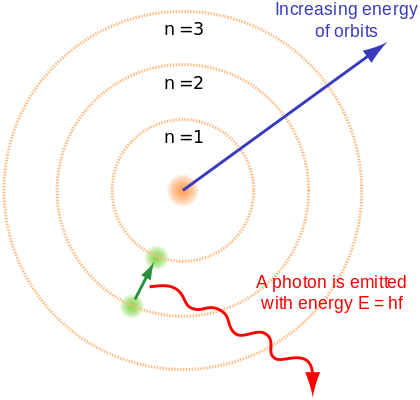
(C.3) Measuring minerals by their electron wavelength
Although light can be described as particles called photons, light is at the same time a wave. This is referred to as the wave-particle duality of light, and there is nothing wrong with saying a photon has a particular wavelength, though we typically use the term “electron wavelength”. The reaction of atoms to heat can then be described as a particular electron wavelength. The wavelength for phosphorus differs from that of zinc, for instance. Just as the human eye can infer the type of material heated by the color of its flame, the ICP determines which types of minerals are present—and at what quantities—by burning the mineral solution and then measuring the electron wavelengths that are emitted.
(C.4) Soil test results: plant-available nutrients other than nitrogen
When I submitted the soil test from Dr. Jones’ field, I specifically requested information on all the minerals that could be measured. The results are below.
You can see that some of the nutrients like calcium (Ca) are measured on a lbs per acre (lbs/A) basis while other nutrients like zinc (Zn) are reported in parts per million (PPM), which may be harder to interpret. PPM is often just another way of expressing the concentrations as mg / liter or mg / kg, depending on whether you wish the concentration to be expressed in terms of volume or weight. PPM is especially useful when talking about very diluted concentrations of a substance. It keeps us from having to write numbers with many decimal-places. Suppose you have a soil where there is 1 milligram of zinc for every kilogram of soil. The zinc in the soil would then be said to be 1 PPM because for every 1 milligran of zinc there is 1*1,000,000 = 1,000,000 milligrams (or 1 kilogram) of soil. To help put it in perspective, if you take a 55 gallon barrel of water and add four drops of ink, that ink concentration will be 1 PPM.(L1)
Figure 5—Excerpt from soil test results regarding a variety of nutrients
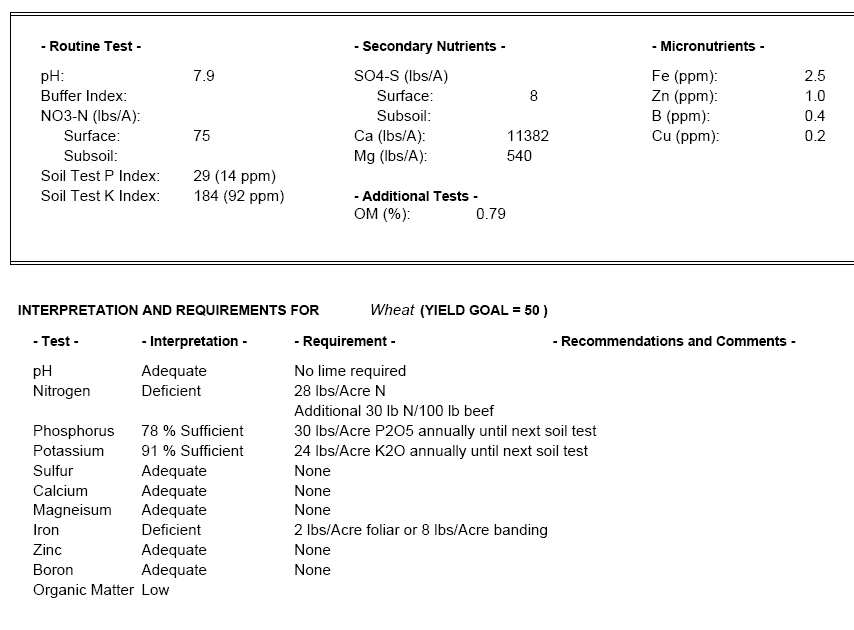
According to the soil test results, there is 1 PPM of zinc in the soil, and if you look at the bottom of the report it says that the zinc levels are “adequate”. Dr. Jones has no need then to apply zinc to his field.
There is too little iron in the soil, though, and so the report recommends that Dr. Jones apply an iron foliar (the term “foliar” means the iron fertilizer is applied directly to the leaves of the plant) at a rate of 2 lbs per acre. Note that this recommendation assumes (see the middle of the report) that Dr. Jones wishes to produce wheat and achieve a yield of about 50 bushels per acre.
(D.1) pH
Any movement in the universe, whether it be in the stars or in the soil, occurs due to one or more of the four forces.
- Gravity
- Strong force (holds the protons and neutrons of an atom together)
- Weak force (responsible for radioactive decay and nuclear fusion)
- Electromagnetism (the forces facilitating interactions between atoms, like when positive and negative charges attract each other to form molecules out of atoms.)
Gravity and electromagnetism are the two forces helping plants acquire nutrients. Gravity helps evaporated water rise and liquid water fall, and directs water to flow downhill where plants are waiting to capture it. Gravity may deliver nutrients in the water, but electromagnetism is often needed for the plant to consume the nutrients.
The hydrogen atom plays a particular important role. The most abundant element in the universe, it can exist alone, possessing one proton and one electron (no neutrons). This atom is stable because the negative and positive charges offset, leaving it with a neutral charge. Being a stable atom, it is not particularly useful in moving nutrients to plants, but if the electron is removed what is left is a single proton with a positive charge, referred to as a hydrogen ion, and is denoted as H+.
Figure 6—Hydrogen and Hydrogen Ion
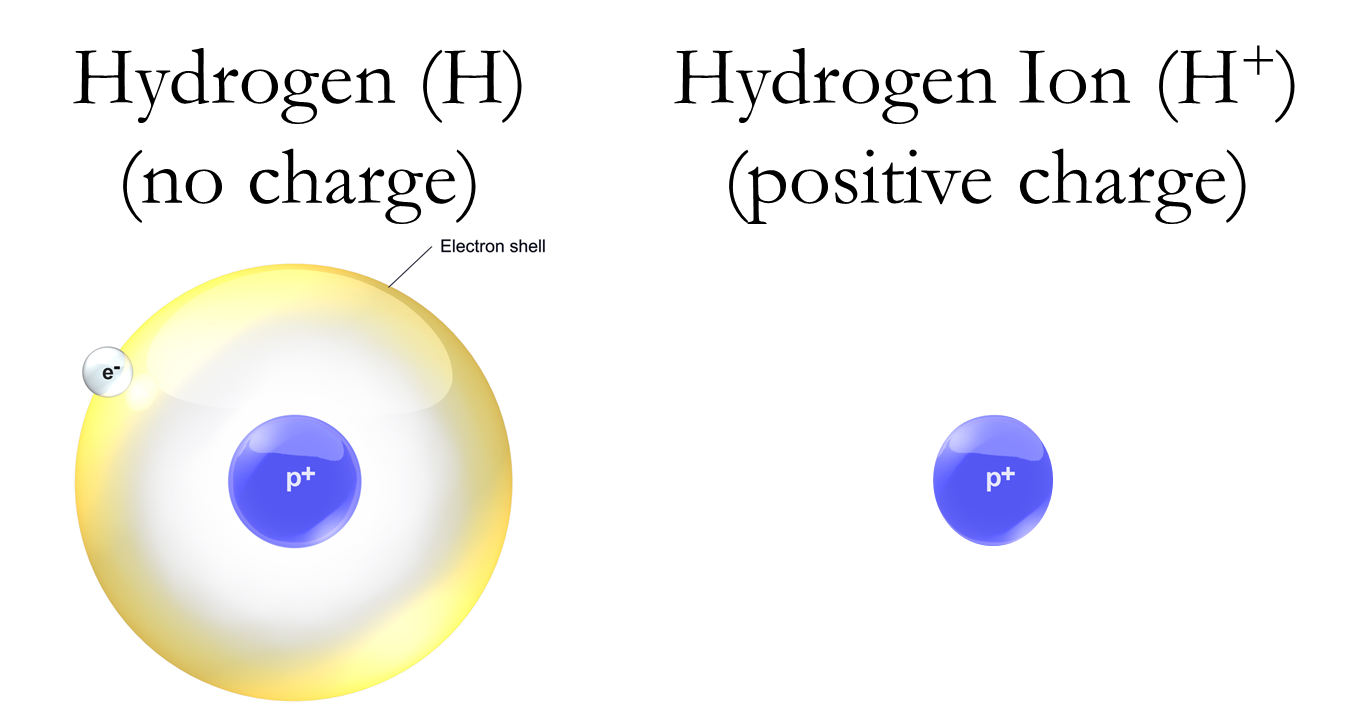
Think of H+ as a magnet, looking to cling to anything with a negative charge and to repel anything with a positive charge. Residing in the soil are other elements with a positive charge, including some plant nutrients. Clay particles in the soil are often negatively charged, and so the positively charged nutrients attach themselves to the negatively charged soil, making the nutrients unavailable to the plant. Plants have evolved a rather clever trick for accessing these nutrients, though: they secrete H+, which then knocks these positively charged nutrients off the clay, and takes their place. H+ is something of a bully, in that in its search for a negatively charged object it doesn’t mind pushing other positively charged objects out of the way. Now that the nutrients are free of the clay they can be taken by water to other locations, some of these being plant roots, where they are then assimilated by the plant.
This is just one example among many of the role of hydrogen ions in plant nutrition. The point is that the movement of nutrients from the soil into a plant requires some force, and hydrogen ions often supply that force due to its positive charge. A plant living in a natural ecosystem will usually emit however much H+ it needs, as it has evolved to survive in soils with a particular number of H+. So long as nothing is added to the soil and nothing from the plant is harvested, that store of H+ usually remains stable.
Agriculture, however, is not a natural system, but the engineering of nature to serve human needs. As farmers add things to the soil like fertilizer, and as they harvest parts of the plant, they alter the soil’s store of H+, often in ways that reduces a field’s productivity. Too few hydrogen ions, and plants have difficulty acquiring nutrients like iron. Too many, and toxic elements like aluminum are taken up into the plant, harming it. Again, use the magnet metaphor. You want a large enough magnet to attract the nutrients needed, but not so large a magnet that you also attract elements that cause harm.(B1,K1,N1) An ideal number of hydrogen ions in the soil is like this ideal magnet.
The number of hydrogen ions in the soil is so important that scientists have developed a precise way of expressing and measuring it. The amount of hydrogen ions is expressed as the variable “pH”. No one knows what the “p” stands for or why it is lower-cased, but we often assume pH denotes the “power” of hydrogen. It is calculated using the following formula.
(Note that the concentration of H+ is measured by molar concentration, and if you don’t know what that is, that is okay. Just imagine it being the weight of hydrogen ions in grams divided by the volume of the liquid containing the hydrogen ions.)
pH = -log10(concentration H+)
In pure water there will be a very small amount of H+ compared to H2O. The concentration of H+ in pure water is 1/10,000,000 = 0.0000001, which is like saying there is one mole of H+ for every mole of water. The pH of water is then
pH = -log10(0.0000001) = 7
Because the pH of water is 7, this threshold of 7 has been deemed “neutral”. Anything less than 7 is thought to be acidic, and anything greater than 7 is considered alkaline.
Consider acidity, which describes solutions with a greater amount of hydrogen ions. Suppose the concentration of H+ is 0.00001. This makes the measured pH equal to 5, reflecting the fact that there is considerably more H+ than in pure water.
pH = -log10(0.00001) = 5 (less than 7, so it is acidic)
If there are very low amounts of H+ then the H+ concentration is low and the pH level is high. This refers to an alkaline solution. For instance, if the H+ concentration is 0.000000000001 the pH level is 12.
pH = -log10(0.000000000001) = 12 (greater than 7, so alkaline)
(D.2) Soil test results: pH
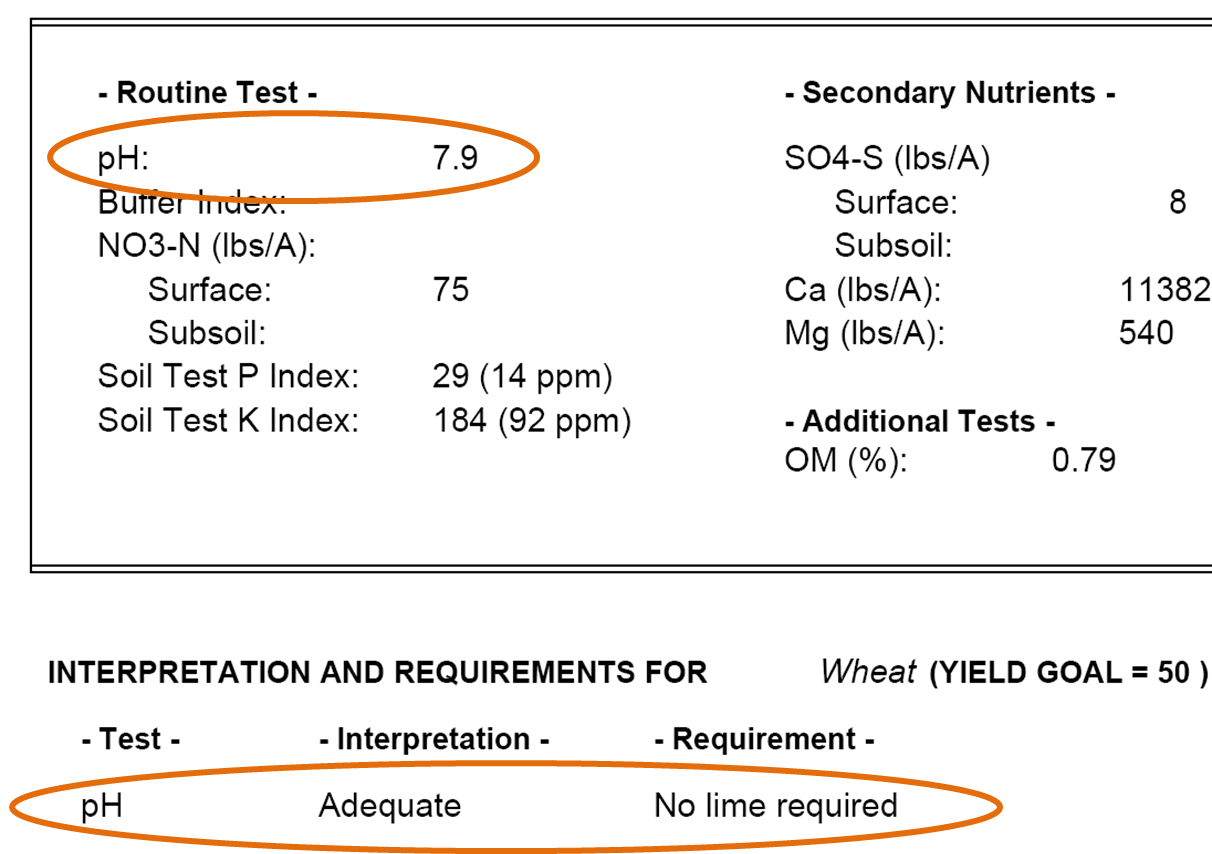
Recall that we acquired a soil sample from my colleague Dr. Rodney Jones. This sample was from a field he intended to plant in wheat. The soil’s pH level was tested and the result is shown below. The pH was determined to be 7.9, which was deemed to be an adequate level for wheat. Notice that it also indicates that no lime is required. Lime is a material containing high levels of calcium, like limestone. Applying it to land tends to increase the pH level of the soil. Typically, fields that have grown crops for many years will become more acidic, and this will be reflected in a low pH. If Dr. Jones’ field became too acidic it would become unsuitable for most crops, and he would need to apply lime to the field to raise the pH level.
Figure 7—Excerpt from soil test results regarding pH
(D.3) How does the soil testing laboratory at OSU measure pH?
Now that we understand what pH is and how pH measurements of soil are used, we are left with the question of how the laboratory measures the number of H+ in the soil sample. Obviously, they cannot count the number of H+ relative to other elements under a microscope, so they instead use a clever way of indirectly measuring H+.
Remember that the electromagnetic force causes changes through the interaction of positively and negatively charged objects. Standard batteries work by first separating positively and negatively charged objects, and then allowing electrons to flow from the negative to the positive side. That flow is electricity.
The H+ are positively charged, which means the more the H+ that exist in a solution the more of them that can interact with electrons to transmit electricity. The pH of a solution is measured by the voltage of electricity it can facilitate.
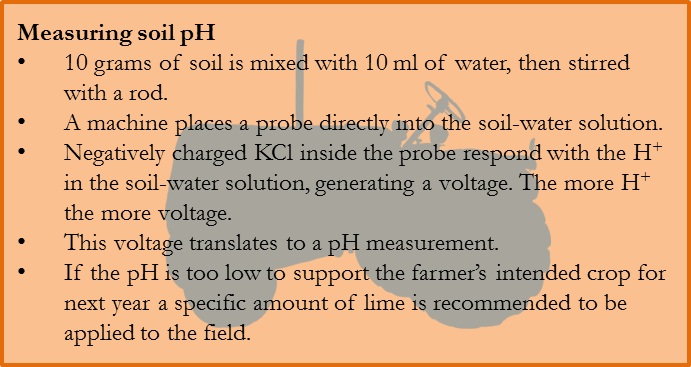
A mixture of 10 grams of soil and 10 ml of water is made and then stirred with a rod. A machine then drops a probe into the mixture. This probe contains within it negatively charged potassium chloride (KCl). Although separated by the probe, the H+, being positively charged, is attracted to the KCl, and their interaction on either side of the probe wall can facilitate an electric charge. The greater the amount of H+, the more voltage it can facilitate, and the voltage measured by the probe provides a direct reading of the soil’s pH.
(E) The science of the soil
When scientists discuss all the reasons for the dramatic increase in yields experienced over the last century, chemical fertilizers are always mentioned. The story of how we learned to capture nitrogen from the sky and convert it to a plant-accessible form is a marvel of human ingenuity, and makes such an inspiring story that books like The Alchemy of Air have been written about it.
What is often missing from the discussion is the technology used to determine how much fertilizer and of what kind to apply, and these are equally fascinating. We have just seen how scientists measure the length of an electron’s wave to determine how much phosphorus fertilizer to apply, how the ability of a carbon gas to absorb infrared radiation is used to measure soil carbon content, and how a liquid’s ability to transmit energy is used to determine whether lime is needed to alter the pH of a soil. Anyone who does not think these technologies to be a marvel is unlikely to be impressed by anything!
FIGURES
(1-2) Original figure.
(3) Available at Wikimedia Commons by Brighteorange. Accessed June 12, 2014 at http://commons.wikimedia.org/wiki/Atom#mediaviewer/File:Stylised_Lithium_Atom.png.
(4) Available at Wikimedia Commons by Brighteorange. Accessed June 12, 2014 at http://en.wikipedia.org/wiki/Electron#mediaviewer/File:Bohr_atom_model_English.svg.
(5) Original figure.
(6) Picture adapted from BruceBlaus at Wikimedia Commons. Accessed June 11, 2014 at http://commons.wikimedia.org/wiki/Category:Hydrogen#mediaviewer/File:Blausen_0527_Hydrogen-2_Deuterium.png.
(7) Original figure.
References
(B1) Bickelhaupt, Donald. Soil pH: What it Means [web article]. E-Center Learning Resources. Environmental Information Series. Accessed June 11, 2014 at http://www.esf.edu/pubprog/brochure/soilph/soilph.htm.
(C1) Crash Course. September 9, 2013. “pH and pOH: Crash Course Chemistry #30” [youtube.com video]. CrashCourse. Accessed June 11, 2014 at https://www.youtube.com/watch?v=LS67vS10O5Y.
(C2) Cain, Fraser. July 22, 2013. “How Hot is the Sun?” [web article]. UniverseToday.com. Accessed June 12, 2014 at http://www.universetoday.com/103634/how-hot-is-the-sun/.
(C3) Chemistry Videos [YouTube.com channel]. Basco36 [username]. February 24, 2008. “Strontium Chloride / made red fire” YouTube.com. Accessed July 7, 2014 at https://www.youtube.com/watch?v=vltFchuGi0Y. Received electronic permission to use video in my classes in June 2014.
(H1) Helmenstine, Anne Marie. “Mass Percent Composition Problem.” About.com Chemistry. Accessed June 7, 2014 at http://chemistry.about.com/od/workedchemistryproblems/a/mass-percent-composition-problem.htm.
(K1) Kantharaj, et. al. Absorption of Mineral Nutrients [webpage]. Accessed June 11, 2014 at http://plantcellbiology.masters.grkraj.org/html/Plant_Cellular_Physiology4-Absorption_Of_Mineral_Nutrients.htm.
(M1) mist8k. June 14, 2013. “How To Make Green Fire.” YouTube.com. Accessed July 7, 2014 at https://www.youtube.com/watch?v=B-fC-lZUa4M.
(N1) Norwood, F. Bailey, Michelle S. Calvo, Sarah Lancaster, and Pascal A. Oltenacu. 2014. Agricultural and Food Controversies: What Everyone Needs to Know Oxford University Press: NY, NY.
(L1) Life Sciences Learning Center. 2011. University of Rochester. Accessed July 7, 2014 at http://www.google.com/url?sa=t&rct=j&q=&esrc=s&source=web&cd=1&ved=0CB8QFjAA&url=http%3A%2F%2Fwww.urmc.rochester.edu%2FMediaLibraries%2FURMCMedia%2Flife-sciences-learning-center%2Fdocuments%2F07_TEACHER_NANO_Silver_4-6-11.pdf&ei=oKm6U7SnBMuMyATPloD4BA&usg=AFQjCNFRLx1_DGNrldkT4-Q8VlAOsYWthw&sig2=M5AdDmD8e2_5pjLQGZ5F7g&bvm=bv.70138588,d.aWw.
(V1) Virtual Soil Science Learning Resources. April 6, 2014. “Inductively Coupled Plasma-Optical Emission Spectometer (ICP...” Virtual Soil Science Learning Resources Accessed June 12, 2014 at https://www.youtube.com/watch?v=g7q_QfQ428c.
(Z1) Zhang, Hailin and Brian Arnall. Not dated. How to Get a Good Soil Sample [fact sheet]. Oklahoma Cooperative Extension Service. PSS-2207.